- The Alpha Letter
- Posts
- The Wealth Machine bets big on this stock
The Wealth Machine bets big on this stock
private equity without the headaches (3 min read)
This is a rare stock owned by an all-star roster of investors.
David Abrams, also known as the “One-Man Wealth Machine” by the Wall Street Journal, allocated ~12% of 13F funds to Lithia Motors (LAD), making it the fund’s second largest position.
Abrams Capital is the second largest owner of LAD after Vanguard.
Noted value investor Glenn Greenberg of Brave Warrior Advisors, which impressively generated ~200% cumulative returns over the past 5 years (that’s what 25% CAGR gets you!), had a significant $217-million position.
Arthur Young of Tensile Capital had LAD as his 4th largest position according to 13F filings.
Their track records are below:
Stock: LAD | CAGR | |||||
|---|---|---|---|---|---|---|
Notable owners | % own of stock | 13F AUM ($m)* | Stock as% of 13F AUM* | 3y | 5y | 10y |
ABRAMS CAPITAL | 8.7 | 5,114 | 11.8 | 8.2 | 15.7 | 7.7 |
BRAVE WARRIOR ADVISORS | 3.1 | 4,512 | 4.8 | 18.6 | 24.7 | 14.4 |
TENSILE CAPITAL | 0.9 | 907 | 7.1 | 2.5 | 19.1 | 16.2 |
*13F AUM is derived from 13F filings and may not represent total AUM
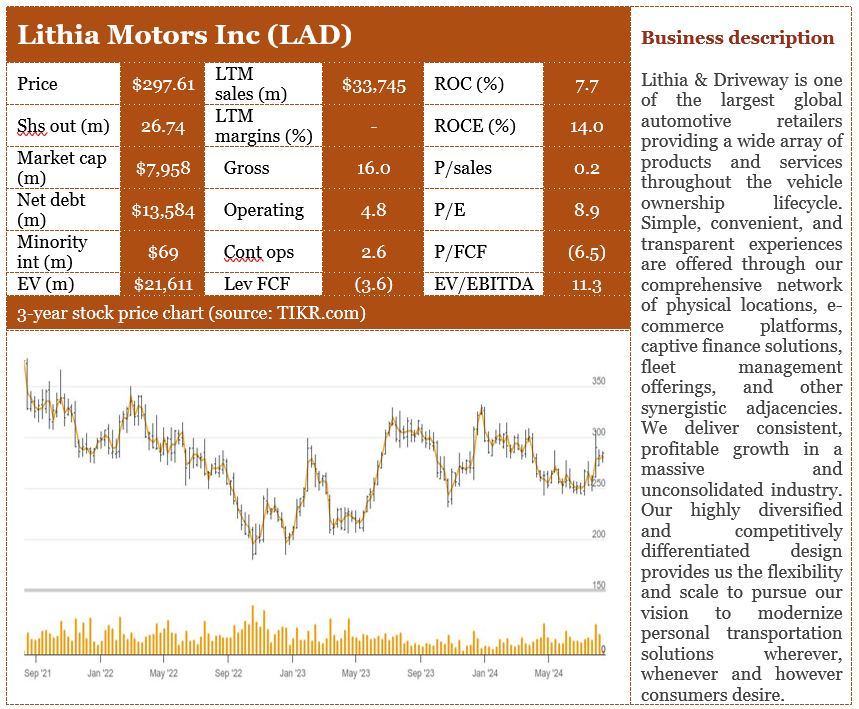
There are plenty to like about LAD.
It functions like a private equity firm focused on buyouts of retail automotive dealerships.
But unlike private equity, it has little competition, decades of industry expertise, and permanent capital that allows it to operate assets and compound capital as long as it deems fit.

It has shown top-notch profitable growth post-GFC as a serial acquirer of automotive dealerships. Since 2010, revenues and normalized diluted EPS have grown 14x and 69x (not a typo) respectively.
ROCE has grown from 4% to 18%, indicating economies of scale as a tailwind. Its increasing size has not yet impeded return on capital.
Delving into economics, LAD has ~2.5% share of new car sales, sufficient to make it one of the largest dealerships of new cars.
However, its 1.5% share of used car sales lags behind market leader Carmax that reported ~4% share.
The good news is that dealerships focusing on new cars seem to have higher margins than those specializing on used cars. LAD, Autonation, and Asbury Automotive reported 16-18% gross margins and 5-6% EBIT margins, higher than Carmax’s 12% gross and 2.6% EBIT margins.
As one of the largest dealerships in the US, LAD has much room for acquisitive growth with its single-digit market share.
LAD is the most active acquirer among its public peers, spending 69% of capital on acquisitions compared to 37% for peers.
LAD may also grow by expanding high-margin segments in servicing and financing.
Selling cars entails lower margins than servicing cars. Auto-parts leader Autozone reported 53% gross margins that are ~3x higher than auto dealerships. Originating loans in-house should also support margins because LAD stated that in-house origination was 3x more profitable than that by third-party lenders.
Servicing and financing make up only 10% and 4% of LTM revenues respectively at LAD, implying plenty of room for growth.
LAD’s low 9x-PE may benefit from a mean-reversion uplift as the Federal Reserve cuts rates for the first time post-Covid.
85% of new car purchases in the US are financed, implying that the level of interest rates is strongly correlated to auto sales. During the zero-rate period between 2010-20, LAD and AN traded as high as 24x PE and averaged in the 15-16x range. More recently they changed hands in the 8-9x range. The ~500bps increase in Federal Funds rate during Covid took its toll on multiples.
Multiples have likely bottomed and may mean-revert as the Federal Reserve nears its first rate-cut in the past-Covid era

Disclaimer
This article and all relevant resources do not constitute investment advice and do not represent any offer or solicitation to offer or recommendation of any investment product. It does not account for individual needs, investment objectives and specific financial circumstances.
Glossary
13F: SEC filing that investment managers with at least $100 million in AUM file quarterly to disclose holdings
AUM: assets under management
CAGR: compounded annual growth rate
Cont ops: continuing operations
EBIT: earnings before interest and taxes
EBITDA: earnings before interest, taxes, depreciation, and amortization
EPS: earnings per share
EV: enterprise value GFC:
Global Financial Crisis of 2008/09
Lev FCF: Levered FCF as defined by S&P CapIQ
LTM: last twelve months
P/E: price to earnings from cont ops
P/FCF: price to levered FCF
P/S: price to sales
ROC: return on capital as defined by S&P CapIQ
ROCE: return on common equity as defined by S&P CapIQ
SEC: Securities and Exchange Commission
Shs out: shares outstanding